Your Executive Dashboard Isn’t Helping the Field

Over a hundred years ago, a struggling steel mill was visited by a company executive looking for answers. Production was lagging badly, despite constant pressure from leadership to improve.
Instead of giving a speech, he asked one worker a simple question: “How many heats did your shift finish today?”
The worker answered: 6. The executive grabbed a piece of chalk, wrote the number on the floor in giant strokes, and walked away. The next shift saw the number, beat it, and crossed it out. The shift after that beat them. Within days, production climbed dramatically.

Nothing about the crews changed. The only thing that changed was visibility.
Commercial landscaping has the same problem today. Many companies already have executive visibility. They can see labor percentages, revenue, branch performance, and company-wide KPIs through PowerBI dashboards, exports, and detailed reporting built around Aspire. But the people closest to the work often still operate without a clear scoreboard.
A crew leader finishes the week without seeing whether their routes actually hit the schedule. A route manager adjusts labor throughout the season without clear visibility into where efficiency is improving or slipping. Operations managers don’t discover recurring issues until month-end reviews or renewal prep.
The problem usually isn’t lack of data. It’s that operational visibility stops at leadership.
Executive dashboards are valuable. They help leadership understand the business. But improving field execution requires a different kind of visibility: simpler, shared consistently, and connected to the weekly rhythm of the operation. Because most teams can technically access the data already, the issue is that they experience it in isolation.
A route manager might look at their own numbers. A branch manager may review efficiency during payroll. Leadership may see labor trends in a dashboard. But very few organizations create shared operational visibility where the same metrics are consistently reviewed across branches, route managers, and crews.
That’s when visibility actually starts changing behavior. Not when data exists, but when it becomes visible, recurring, and actionable across the organization.
For many commercial landscapers, Scheduled vs. Actual becomes one of the clearest operational scoreboards for that conversation. Not because it’s complicated, but because it creates a shared understanding of whether the field is executing the plan consistently.
The teams we see doing this best usually have a few things in common:
- Weekly leaderboard emails sent to branch and operations leaders
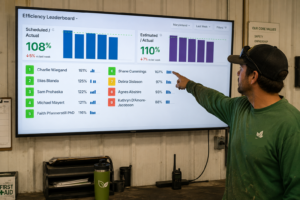
- TV leaderboard displays visible in the shop
- Recurring 30-minute operational reviews
- Shared visibility across branches and route managers
- Consistent conversations around Scheduled vs. Actual and Estimated vs. Actual trends
None of this is complicated technically, but it does require operational discipline. Because the goal isn’t to turn landscaping into a competition. The goal is to shorten the time between when a problem happens and when the field can actually see it clearly enough to fix it.
That’s where operational improvement starts.