NAVIGATION
Welcome
Aspire Integration
User Roles
Saved Leaderboards
Weekly Leaderboard Emails
TV Leaderboard Display
Advice & Focus Areas
Leaderboard Definitions
Sales Leaderboard

Welcome to BomData
Whether you’re exploring BomData for the first time or setting up your account, this guide walks you through how to connect Aspire and start seeing clear, actionable insights.
BomData helps commercial landscapers turn Aspire data into dashboards, leaderboards, and weekly reports that drive efficiency and profit—without extra setup or spreadsheets.
Key Principle: Focus on Patterns, Not One-Offs
When analyzing your data, look for consistent trends and recurring inefficiencies rather than isolated incidents. Addressing patterns will drive the biggest improvements in labor optimization.
Use the following advice to kickstart your usage of BomData:
Best Practice Tip: Start with a Single Branch
For larger organizations, we recommend rolling out BomData at one branch first before expanding company-wide.
Why Start Small?
- Test what works best for your team
- A/B test improvements before scaling
- Measure impact and refine processes
Which branch should we start with?
We recommend beginning with a branch manager who is enthusiastic about adopting new technology. Choosing someone who naturally embraces change and recognizes the potential for improved labor efficiency is key. Once this branch successfully implements BomData and demonstrates clear improvements, it will pave the way for other branches to follow suit.
Set Up Your Aspire Integration
In order to start viewing your data, you’ll first need to set up an Aspire integration. To collect and display data from Aspire, we need REST API access.
Follow these steps:
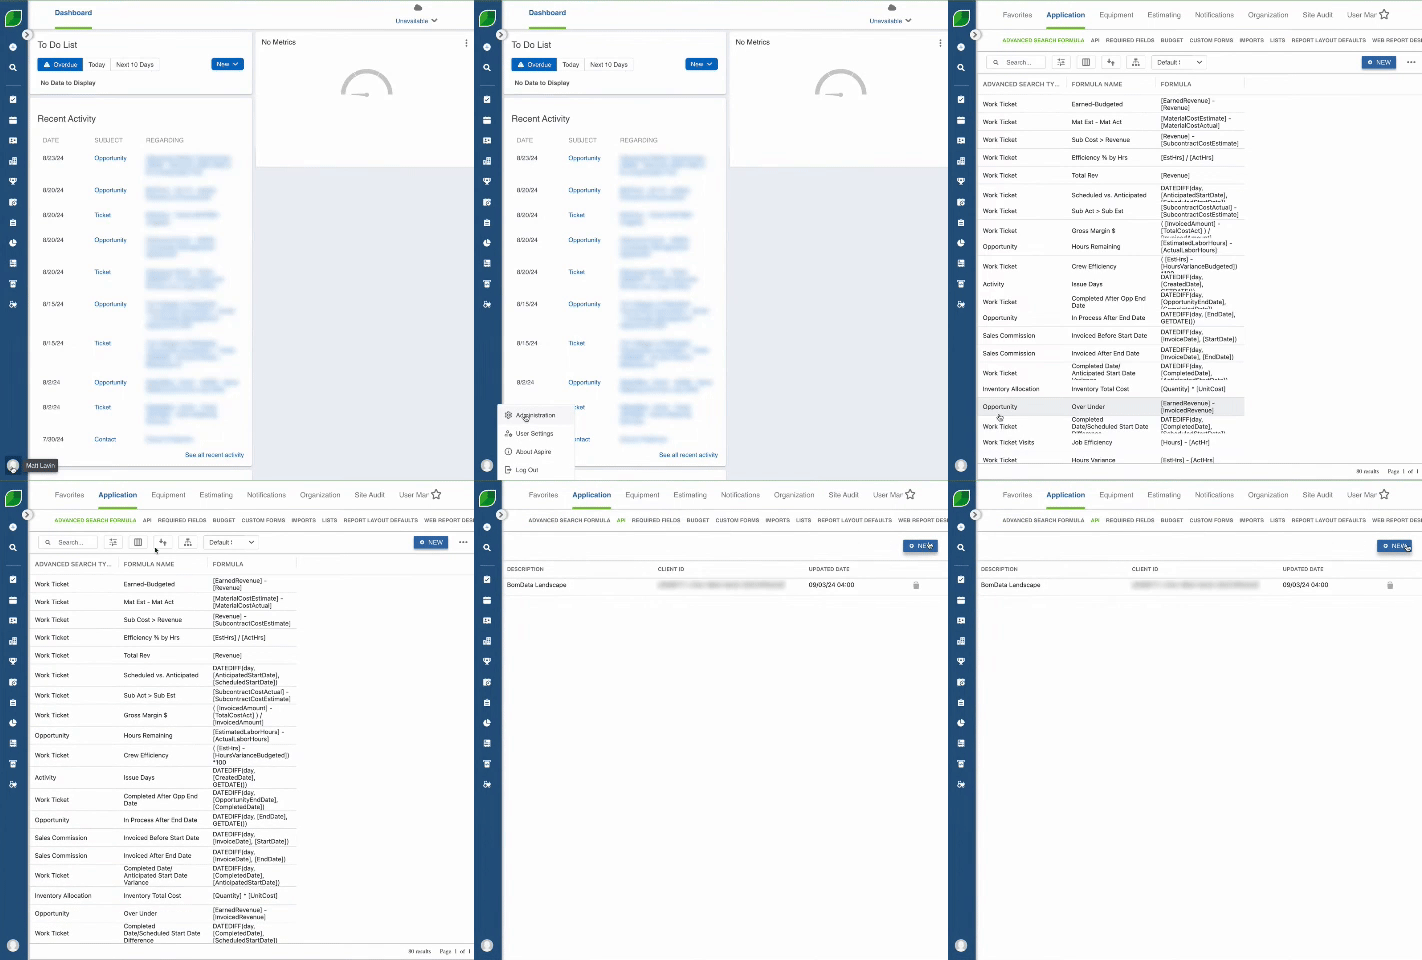
In Aspire
- As an Aspire administrator, login to https://cloud.youraspire.com/
app - Click ‘Settings’ in the bottom left corner of the page
- When the navigation bar is collapsed, it looks like your photo.
- Click ‘Administration’ in the left navigation area
- When the navigation bar is collapsed, it looks like a gear
- Click ‘Application’ -> API
- Click ‘New’
- Make note of both the Client ID and Secret
- The secret only displays once. If you forget to write it down, go through these steps again
- Select ‘Select all GET’ in the scope section
- Set a description and click ‘Save’
In BomData
-
Log into https://dev.landscape.bomdata.
io/ -
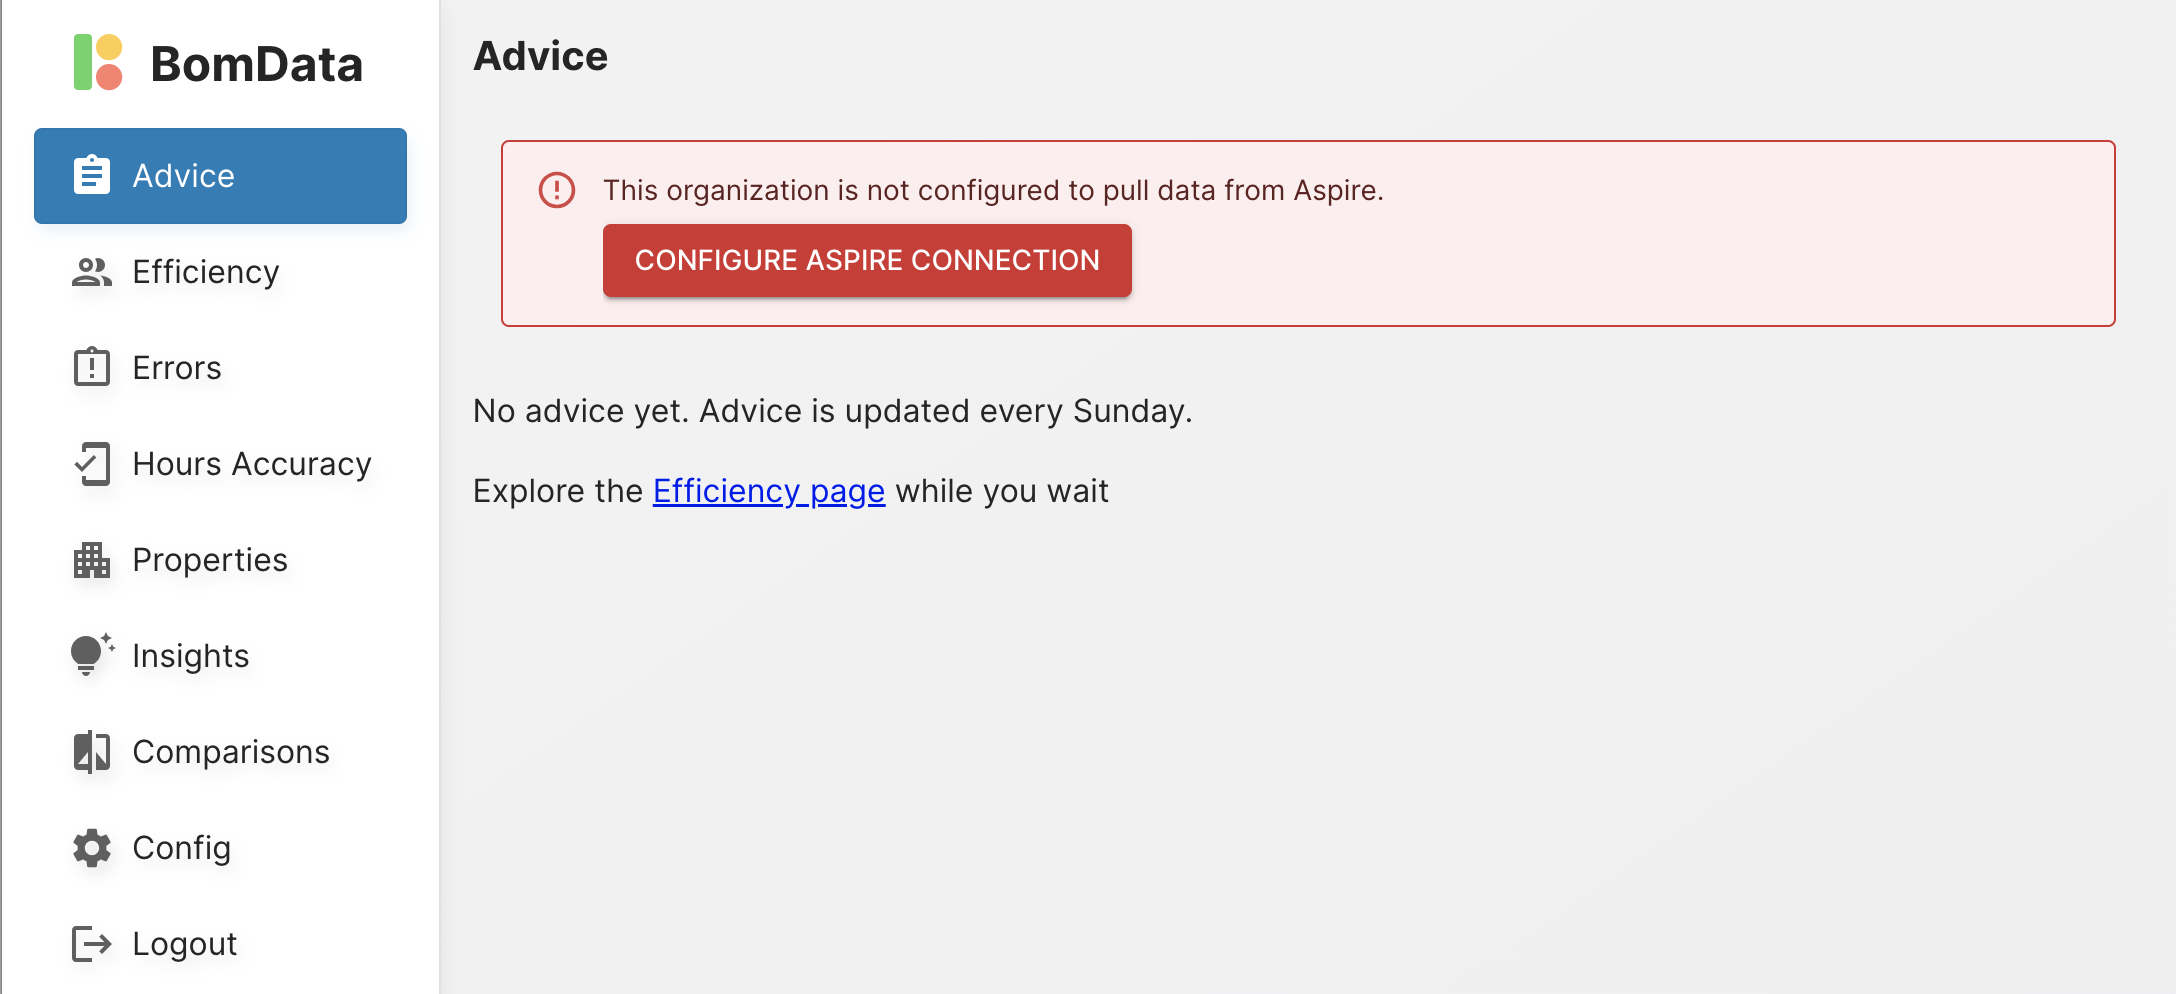
You should see a message pointing you to the Aspire configuration page. Click the ‘Configure Aspire Connection’ button.
-
Input the Client ID and Secret on the configuration page.
-
Once you’ve provided the secrets, click the ‘Update’ button. When you do, you should see the test results reload.
-
When you get the success message, let us know so we can start pulling data for analysis
Assign the Right User Roles
Setting up users with the correct roles ensures they see the most relevant data and can take action efficiently.
How to Set Up Users in BomData
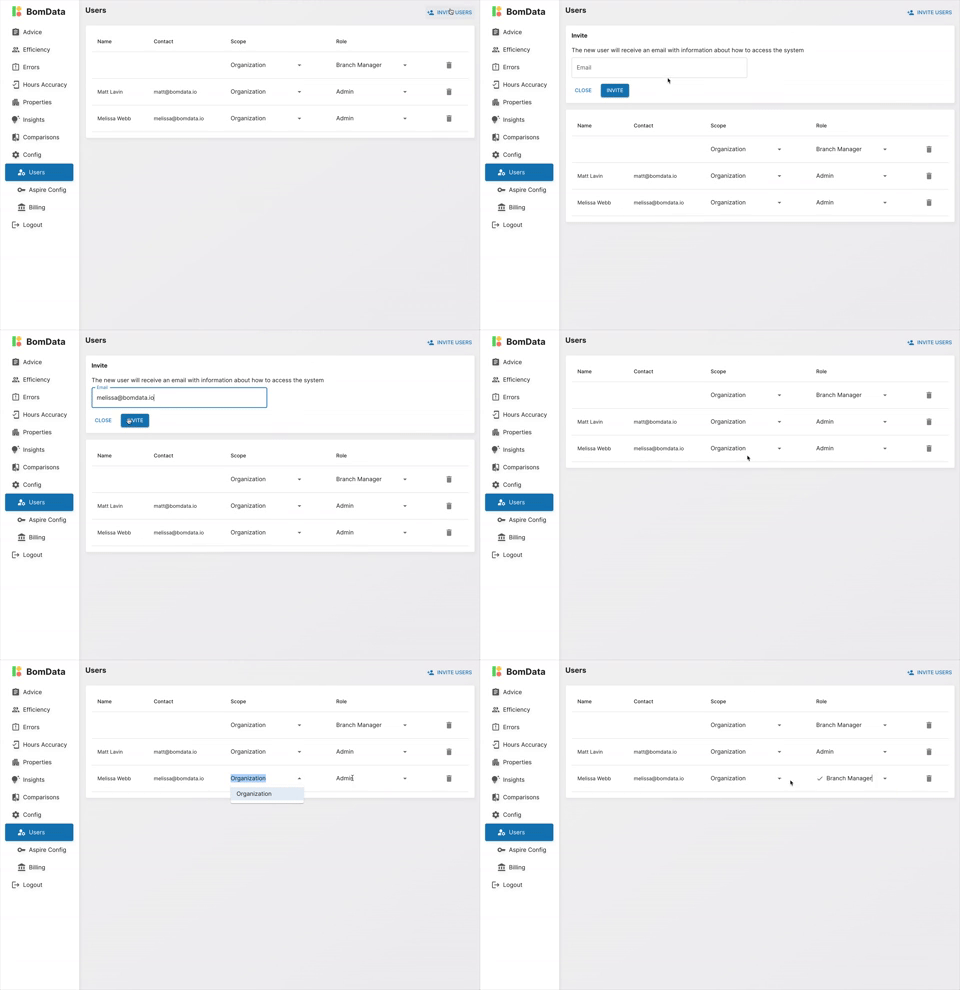
- Navigate to Config > Users
- Click INVITE USERS in the top right-hand corner
- Once invited, update the user’s Scope & Role
Example: Setting Up a Branch Manager
- Set Scope to their branch so they see their team’s data by default
- Users can still access company-wide data, but their default view keeps them focused
Tip: Setting roles and scope correctly for Branch Managers, OMs, and RMs will automatically enroll them in weekly advice emails, sent on Mondays.
Create Saved Leaderboards
Creating saved leaderboards helps you quickly switch views to exactly what you want to see, and it’s also a prerequisite to setting up automated weekly emails.
How to Create a Saved Leaderboard
- Select the Leaderboard where you’d like to start
- Select the filters you want applied
- Click Save in the top left-hand corner, provide a descriptive name, and select the default time range
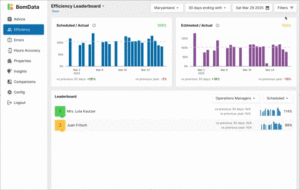
To access saved leaderboards, click on the arrow next to the leaderboard name

Automate Weekly Leaderboard Emails
Configuring automated leaderboard emails keeps your team engaged and focused on key improvement areas.
Who Should Receive Leaderboard Emails?
- Crew Leaders – Reinforces scheduling and Crew Mobile goals
- OMs / RMs – Reinforces scheduling and ticket error goals
- Branch Managers – Helps them track performance
- Executives – Provides high-level insights without extra effort
Best Timing for Emails
Send leaderboard emails the day after Aspire maintenance ticket approvals to ensure accurate data.
How to Set Up Weekly Leaderboard Emails
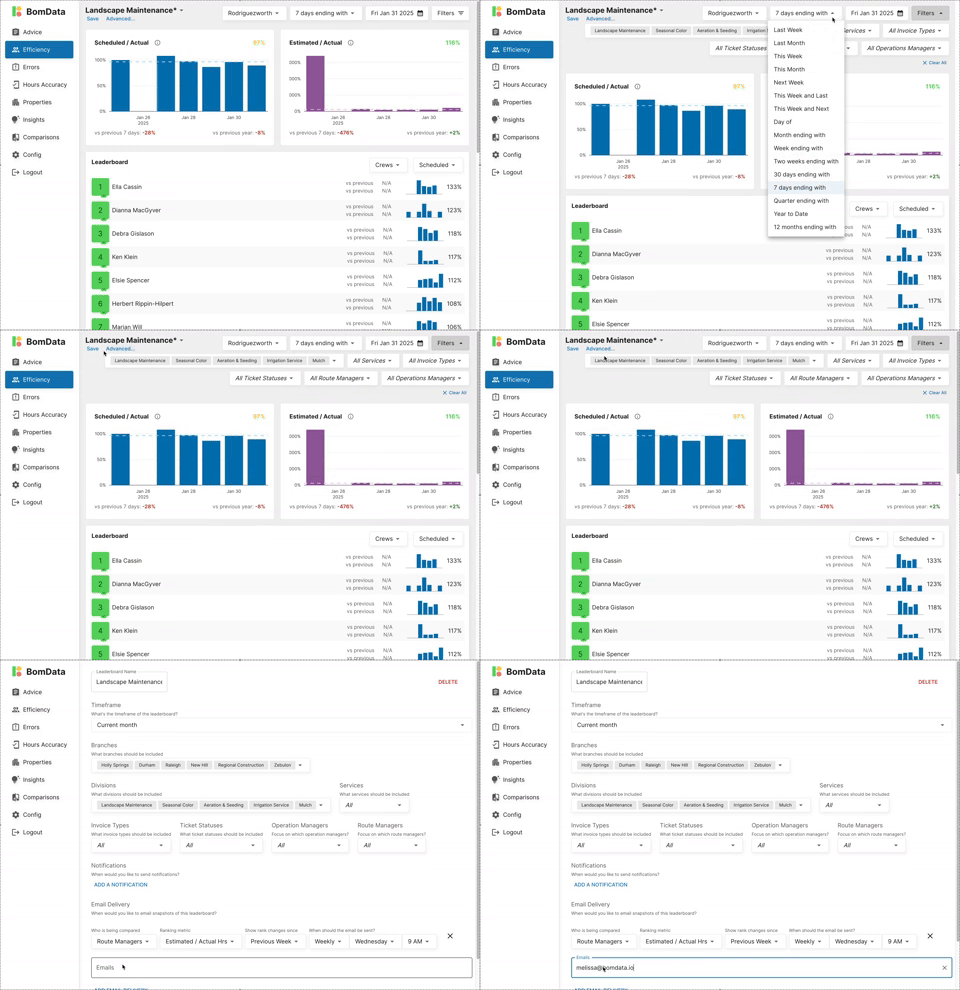
- Navigate to the Efficiency page and select the Leaderboard you want to share
- Click Advanced…
- Scroll to the bottom and click ADD EMAIL DELIVERY
Tip: Focus emails on key problem areas. If scheduled hours are a challenge, create a leaderboard tailored for Crew Leaders.
What is the most popular weekly leaderboard to start with?
The best weekly leaderboards for your organization should include the areas you are trying to encourage the most change. Weekly emails can be sent at an organization leadership level, branch leadership level, and to teams of Operations Managers, Crew Leaders, or Route Managers. Here are a few examples of successful Weekly Leaderboard Emails:
Weekly OM Efficiency Leaderboard
- Ranking: Operations Managers across the organization (or branch) for estimates vs. actuals last week
- Sent: On Mondays to leadership & OMs, showing last week’s final rankings
- Focuses on: Low efficiency visits and generally increasing margin between estimates and actuals
Weekly Crew Efficiency Leaderboard
- Ranking: Crew Leaders across the organization (or branch) for scheduled vs. actuals
- Sent: On Mondays to leadership & Crew Leaders, showing last week’s final rankings
- Focuses on: Low efficiency visits and ensuring crews are hitting schedules they’re given
Weekly Error Leaderboard
- Ranking: OMs or RMs across the organization (or branch) for a rolling 7-day ticket error rate
- Sent: Once or twice a week to leadership and OMs or RMs, showing a rolling ranking
- Focuses on: Aspire ticket errors, such as overscheduled tickets (or ticket dragging), 0 hour visits scheduled, unassigned crews, and unscheduled visits
Weekly Crew Mobile Leaderboard
- Ranking: Crew Leaders across the organization (or branch) for a rolling 7-day Crew Mobile usage rate
- Sent: Once or twice a week to leadership and Crew Leaders, showing a rolling ranking
- Focuses on: Consistent Crew Mobile usage in the field
Engage Crews with a TV Leaderboard
Displaying real-time crew performance on a TV in crew areas can drive engagement and improve efficiency.
How to Set Up a TV Display
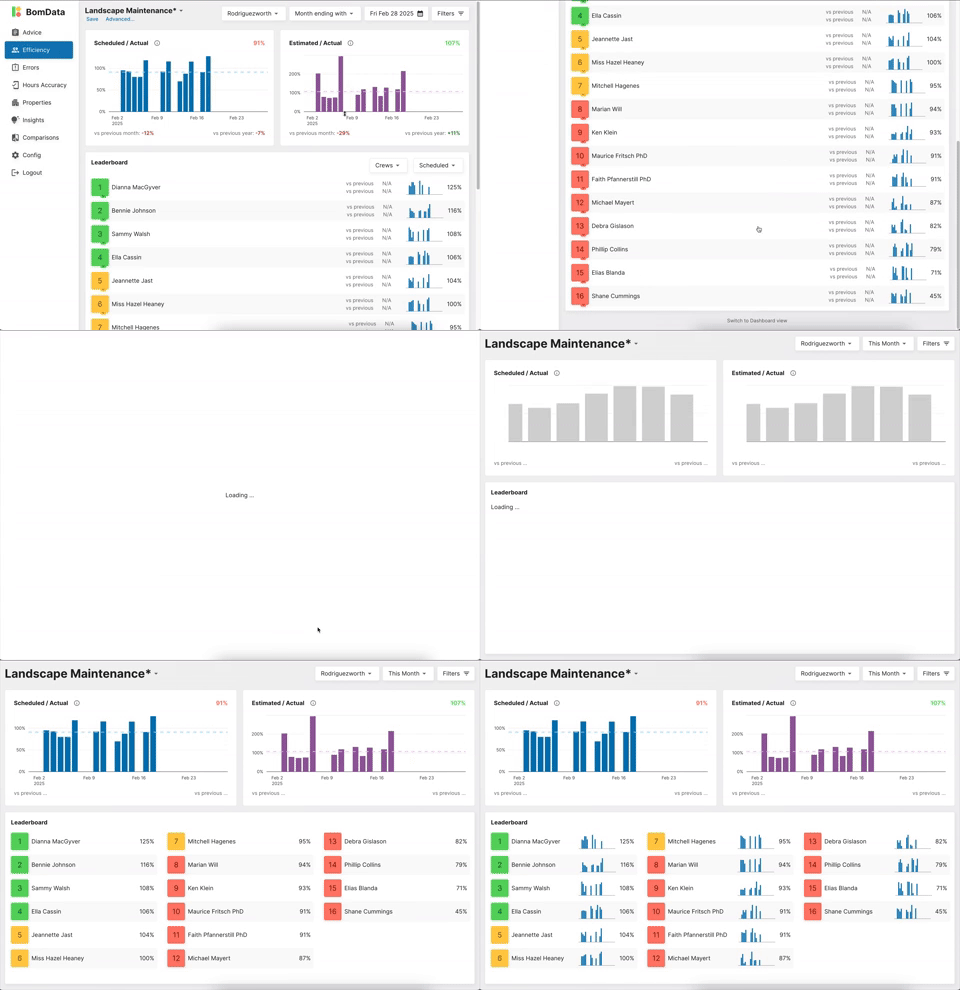
- Configure the leaderboard page in BomData to match how you want it reflected
- Click “Switch to Dashboard View” at the bottom—it will refresh automatically
- Display on a Chromecast with zero set-up, or use an Amazon Fire TV Stick to enable a digital signage tool like:
Should I use Chromecast or a Digital Signage Tool?
It depends on your goals. The advantage of a digital signage tool like OptiSigns or ScreenCloud is that it allows you to cycle through multiple screens, like a newsletter or other information you want to share with the team. It does come with a monthly fee though, whereas Chromecast is a one-time cost. Many companies start with Chromecast and upgrade later.
How is ranking calculated for leaderboards?
As you start displaying these leaderboards, crews often have questions about how ranking is calculated. We’ve outlined the two most common leaderboard displays below.
Imagine a completed work ticket with the following details:
- Estimated at: 6 hours
- Scheduled for: 5 hours
- Actually completed in: 4 hours
- A Scheduled vs. Actual Crew Leaderboard ranks crews on how well they’re executing against the schedules they’re given. For example, if a crew was scheduled for 5 hours and they finished in 4 hours, the crew’s score for that ticket would be 125%. Scores are calculated on a per visit basis and are scaled, so larger tickets are weighted accordingly against smaller tickets.
- An Estimated vs. Actual Route Manager Leaderboard ranks RMs on how well they’re scheduling crews against estimates. For example, if a ticket was estimated at 6 hours and the crew completed it in 4 hours, the RM’s score for that ticket would be 150%. Scores are calculated on a per visit basis and are scaled, so larger tickets are weighted accordingly against smaller tickets.
Note that estimated scores are calculated on the entire work ticket because the data is only available after the work ticket is complete. The delay until full completion is one reason why it’s useful to judge crews on scheduled vs. actual.
What is the most popular leaderboard to display?
The most popular and effective leaderboard display for crews is “7 days ending with” today, or Rolling 7 Days, filtered on Scheduled / Actual. This shows the crews how they rank on hitting schedules over the last 7 days of work.
Two reasons why 7-day rolling is a good timeframe to start with:
- Jobs are recent, so it’s fresh in everyone’s minds.
- Crews can make small adjustments and change their ranking quickly because each day is 1/7 of their score, so they don’t lose motivation.
Use the Advice Page to Prioritize Focus Areas
The Advice Page highlights the highest-impact opportunities for efficiency gains.
Look Beyond Surface-Level Performance
Remember, your top performers might also have the most room for improvement simply because they handle the most work.
Focus Area: Optimize Efficiency Metrics
1. Scheduled/Actual Ratio
- Target: 100% (crews should be scheduled for exactly the time needed)
- A ratio above 100% suggests crews could finish faster or might be taking shortcuts
- Tightening schedules provides more accurate bidding data
2. Estimated/Actual Ratio
- Target: Above 100% (jobs are completed in less time than estimated)
- A ratio below 100% means your team might be scheduling exactly as estimated—consider refining estimates based on real-world performance
- Common Issue: Unscheduled Visits may pull this number down—check the Errors page for patterns
Example Scenario
If a crew regularly finishes early, consider:
- Assigning them additional tasks
- Reducing crew size for efficiency
- Adjusting scheduled time to better match real execution time
Focus Area: Improve Crew Mobile Usage
Accurate time entry is critical—Aspire data is only as reliable as what gets entered.
- Ensure crews log time when starting and ending a job
- Target Hours Accuracy Score: Above 75
- A ratio below 75 suggests that teams are editing entries well after jobs have started or finished. Pinpoint crews with low scores and review patterns in time entry
Focus Area: Proactively Fix Scheduling Errors
Review Next Week’s Errors Every Friday
Avoid wasted hours by checking scheduled tickets before the week begins.
Friday Afternoon Checklist
- Ticket Dragging – Prevent old tasks from carrying over unnecessarily
- Zero-Hour Visits – Identify and correct them before crews are assigned
- Double-Booked Crews – Resolve conflicts to avoid scheduling inefficiencies
Key Question: What can I do differently next week to improve efficiency?
Focus Area: Data Cleanup
Many companies realize their Aspire data isn’t as clean as they thought when they start using BomData. Clean data leads to better decision-making and efficiency improvements.
Common Data Cleanup Tasks
- Old Employees – Ensure inactive crew members are removed from tickets in Aspire
- Ticket Dragging & Other Errors – Use the Errors page to identify mistakes like:
- Inflated Scheduled/Actual ratios due to improper ticket scheduling
- Duplicate or misassigned tasks
- Decentralize Data Ownership –
- Empower Branch Managers & Operations Managers to review and correct their own errors
- Use BomData insights to push accountability down the organization
Tip: All errors in BomData link back to the Aspire ticket for easy cleanup.
Leaderboard Definitions
Read below to understand what each leaderboard represents and breakpoints for red, yellow, and green statuses.
Efficiency Leaderboard
The Efficiency Leaderboard displays two key efficiency metrics for visits completed during the selected time period.
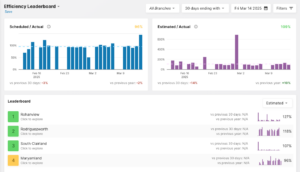
Scheduled / Actual
This metric measures how effectively crews execute their assigned schedules.
| Performance | Breakpoint | Interpretation |
|---|---|---|
| Green | 100% and above | Crews are hitting or exceeding scheduled hours. |
| Yellow | 95% – 99% | Crews are performing just under scheduled hours by a few percentage points. |
| Red | Less than 95% | Crews are taking over 5% more time than what was scheduled. |
Estimated / Actual
This metric evaluates how accurately Route Managers are scheduling crews based on estimates.
| Performance | Breakpoint | Interpretation |
|---|---|---|
| Green | 105% and above | Jobs are completed with at least a 5% margin over the estimated hours, indicating efficient scheduling. |
| Yellow | 95% – 104% | Jobs are being completed close to their estimated time. |
| Red | Less than 95% | Jobs are taking over 5% more time than estimated, signaling scheduling inefficiencies. |
Hours Accuracy Leaderboard
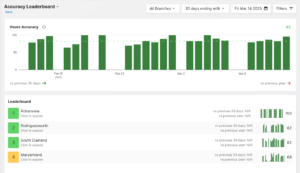
The Hours Accuracy Leaderboard tracks how consistently crews use Crew Mobile (or Aspire Mobile) for recording work hours. A perfect score of 100 means that the crew is fully compliant with the system and never manually edits their time entries.
| Performance | Breakpoint | Interpretation |
|---|---|---|
| Green | 80 and above | Crews are using Crew Mobile as intended, and hours are reliably tracked. |
| Yellow | 60 – 79 | There are some issues with using Crew Mobile, which may affect the accuracy of recorded hours. |
| Red | Less than 60 | Crews are not using Crew Mobile consistently, leading to potentially unreliable hour tracking. |
Errors Leaderboard
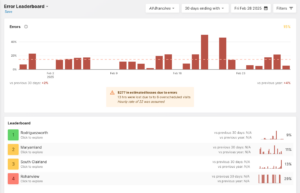
The Errors Leaderboard measures the percentage of visits with a scheduling error during the selected time period. Scheduling errors can significantly impact crew efficiency, so minimizing them is crucial.
| Performance | Breakpoint | Interpretation |
|---|---|---|
| Green | 10% or less | Scheduling errors are low, indicating that Route Managers are effectively using Aspire. |
| Yellow | 11% – 25% | Some scheduling errors are present; addressing these could improve crew efficiency. |
| Red | More than 25% | A high rate of scheduling errors suggests several issues that need to be addressed. |
Types of Errors
- 0 Hour Visit – A visit was scheduled, but it was scheduled for 0 hours, giving the crew no guidance on how long they should spend at the visit.
- Overscheduled Ticket – A visit was scheduled on a ticket that has caused the Work Ticket’s scheduled hours to exceed the estimated hours. This is sometimes caused by ticket dragging, or not adjusting the scheduled hours for a visit.
- Unassigned Crew – A crew was assigned to visit the site, but a different crew showed up.
- Unscheduled Visit – A crew visited a site that was not on the schedule for the day.
Additional Definitions
Efficiency Leaderboard
- Actual – The crew’s logged time entry for visit(s) on the given day.
- Estimated – The estimate assigned to the Work Ticket from the Opportunity.
- Scheduled – The Work Ticket hours assigned to the crew for visit(s) on the given day.
- Ticket Statuses – When drilling into Visits on the leaderboard, you’ll notice some don’t have numerical values for Estimates, Scheduled, and Actuals:
- Unfinished Status – When viewing the Leaderboard ranked by Estimated, a Visit shows an estimate of “Unfinished” before the Work Ticket is marked complete so it is not included in the calculation until complete. Visits associated with the Work Ticket will show Scheduled & Actual values when viewing the board ranked by Scheduled.
- Future Status – The Visit is scheduled for the future and no work has been completed yet.
- Unvisited Status – The Visit was scheduled to be completed in the past and was never completed.
- Skipped Status – The Visit was marked complete without any work being done.
- N/A – The value cannot be computed until the Work Ticket is completed.
- Adjusted Scheduled Hours
When a Work Ticket’s total scheduled hours exceed 120% of its estimated hours, BomData applies an adjustment to improve the accuracy of crew efficiency comparisons. This helps ensure one crew isn’t unfairly ranked due to over-scheduling.
You’ll see a yellow symbol next to affected visits on the Leaderboard.
How it works:
BomData reduces the visit’s scheduled hours proportionally so the crew’s efficiency percentage is more realistic compared to other crews. This prevents inflated efficiency scores that could result from over-scheduled visits.
For example, if a Work Ticket had:
Estimated Hours: 80
Scheduled Hours: 120
Our calculation would be 80/120=.667
If one of the visits was scheduled for 40 hours, the adjusted scheduled hours shown on the efficiency leaderboard for that specific visit is 40*.667=26.67.

Crew Leader – This field is populated by the Crew Leader in Aspire who is responsible for punching in the Crew Mobile hours for their team.
Operations Manager – This field is populated by the Opportunity Manager assigned to the Work Ticket in Aspire.
Route Manager – This field is populated by the Route Owner field on a given Route in Aspire. Each “Route” is a first class object that can be managed and assigned.
Invoice Type – The Invoice Type is pulled from the Aspire Work Ticket. If an Invoice Type is not defined at the Work Ticket level, BomData defaults to the Invoice Type set at the Opportunity.
Sales Leaderboard
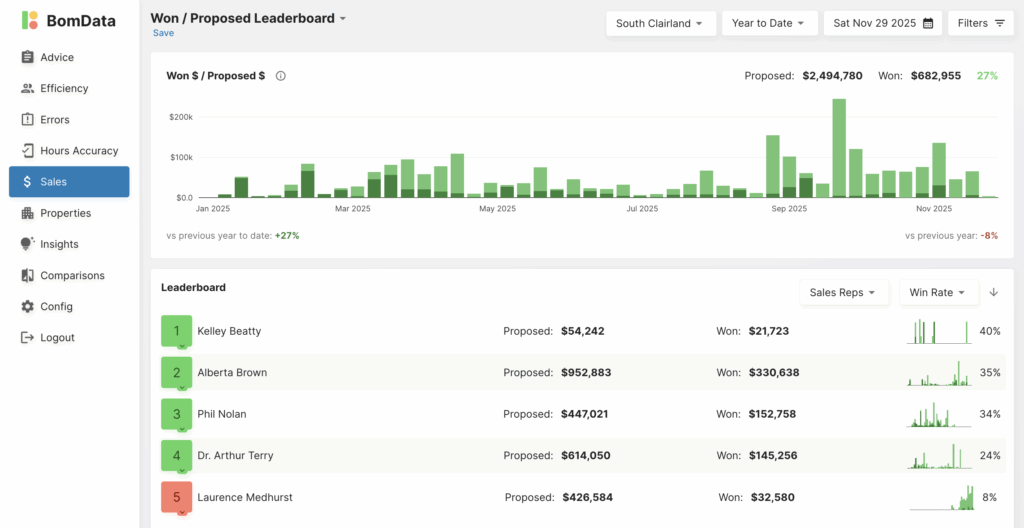
Give your team visibility into how they’re selling — not just what they’ve sold.
BomData has always been built for the people doing the work, not just the ones reading reports. Our leaderboards give field teams the clarity they need to make smarter decisions in real time, and our customers have seen how that drives better outcomes across operations.
The Sales Leaderboard brings execution-level visibility to your sales team in the same way. It helps reps and account managers understand their own activity, gives managers better coaching tools, and creates a rhythm around sales performance that’s easy to maintain and hard to ignore.
It’s not meant to replace Aspire. It’s designed to spark better conversations, faster decisions, and more consistent results.
Who is this for?
-
Sales Managers and Branch Leaders who want a weekly pulse on rep performance and easy places to focus coaching
-
Account Managers and Business Developers who want to track their own activity
-
Executives and Owners who want to spot high-level patterns in team performance
When Should I Use This?
-
Weekly sales meetings: Guide the conversation and recognize standout activity
-
One-on-one coaching: Identify reps who need support on proposal volume or closing
-
End-of-month or quarterly reviews: Evaluate win rates and inform future sales planning
-
On a TV display: Like ranking by “Proposed $” as a motivational tool
What’s Included in the Leaderboard?
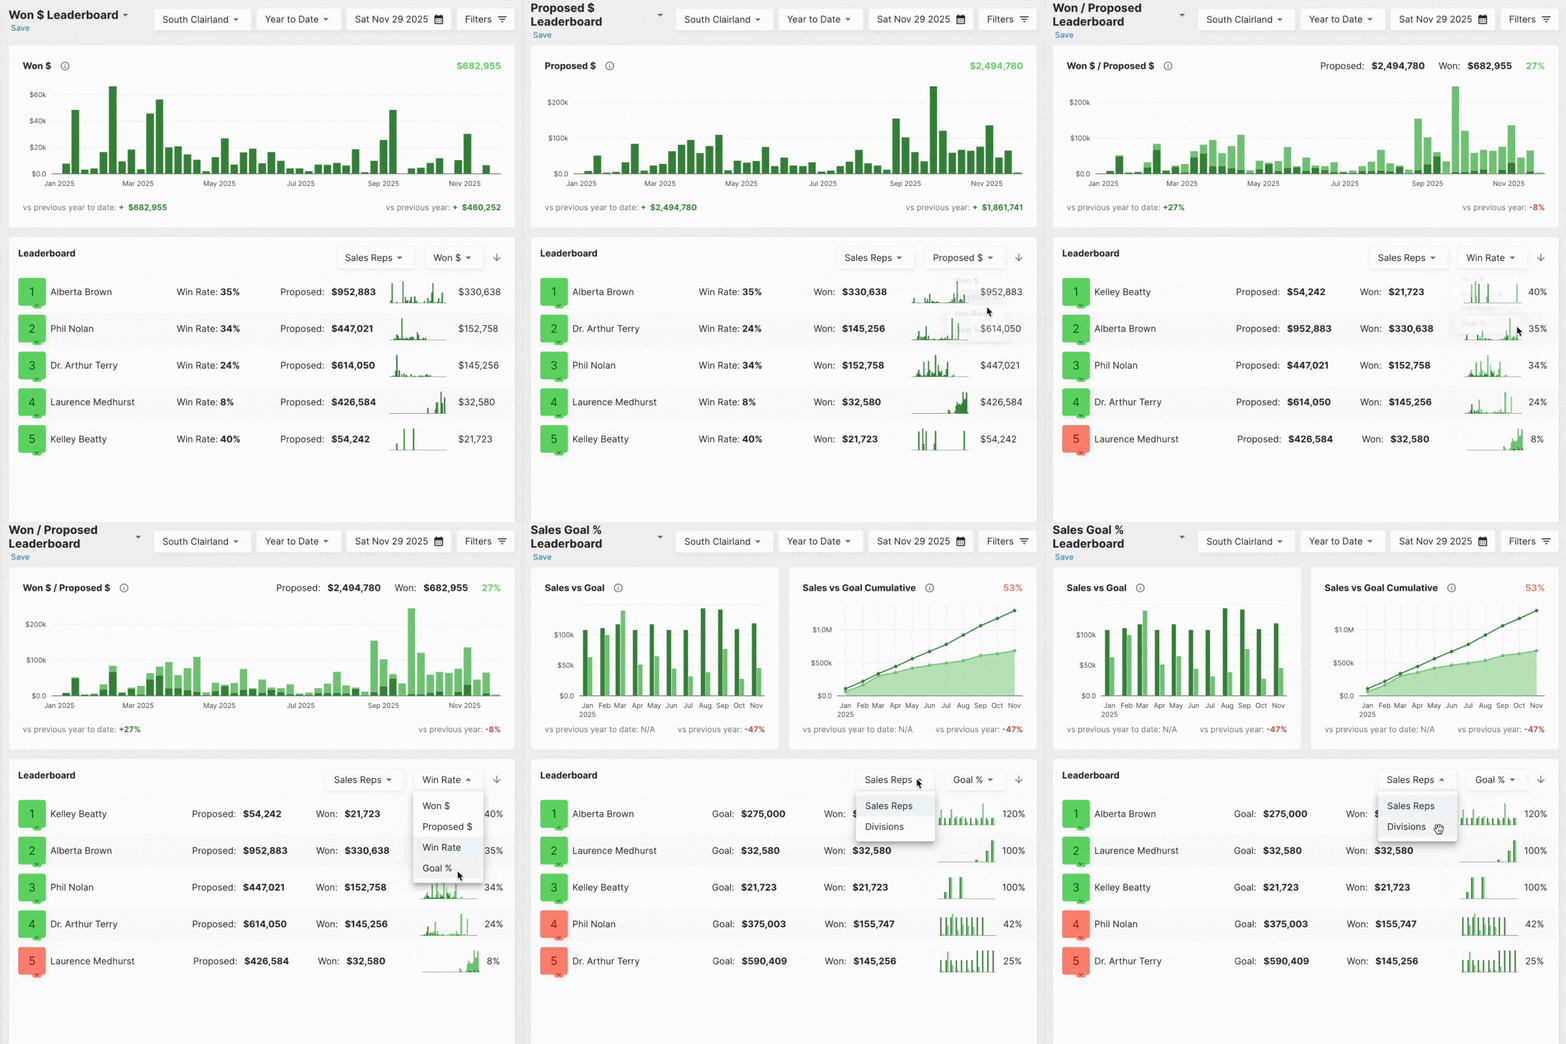
The Sales Leaderboard lets you rank sales reps by four key metrics, filtered by any date range you choose.
| Column | What It Shows |
|---|---|
| Close Rate (%) | % of proposed dollars that were also won within the selected date range |
| Won $ | Total dollar value of deals that were both proposed and won within the date range selected |
| Proposed $ | Total dollar value of proposals submitted within the date range |
| Goal % | Track each sales rep’s percent to goal for the month or YTD |
📌 Note: A deal will only appear in Won $ if it was both proposed and won inside your selected time window.
Example
If your selected date range is the last 60 days:
-
A $50K deal proposed and won within those 60 days → Counts in Proposed and Won
-
A $30K deal proposed 75 days ago but won 30 days ago → Won’t appear at all
-
A $20K deal proposed yesterday but not won yet → Counts in Proposed
This approach helps focus on how your team is performing within a defined sales cycle.
Should I Use Short or Long Timeframes?
Short timeframes (like “this week” or “this month”)
-
Great for managing the top of the funnel, especially Proposed $ and how deals are moving
-
Helpful for weekly rhythm and motivating reps
Longer timeframes (like last 90 days or YTD)
-
Useful for setting goals, analyzing trends, or reviewing win rates over time
-
Used for commission planning or performance evaluations
Common Questions
Q: Why isn’t a deal I just won showing up?
A: It may be because the proposal was made before your selected date range. The leaderboard only shows wins from proposals made during the chosen timeframe.
Q: What if one of my sales reps has a high close rate but low dollar value?
A: That could signal they’re being too selective with proposals. This is a good coaching moment.
Q: What’s the most useful column to start with?
A: You could start by tracking Proposed $ to encourage reps to keep building the funnel. That’s also the cleanest metric in short windows since it doesn’t rely on close timing.
Q: Can I use this as a leaderboard on our office TV?
A: Yes! We recommend ranking by “Proposed $” and filtering by “This Week” or “This Month.” Use Chromecast or a tool like ScreenCloud for display (see TV Leaderboard Display section above).
Q: Can I get these emailed weekly?
A: Yes! We recommend starting with Proposed $ MTD and YTD, and Goal% MTD and YTD to keep the team momentum.
