
The 30-Second Test: How Fast Can Your Landscape Data Turn Into Action?
What landscaping leaders can do now to build the foundation for useful, responsible AI
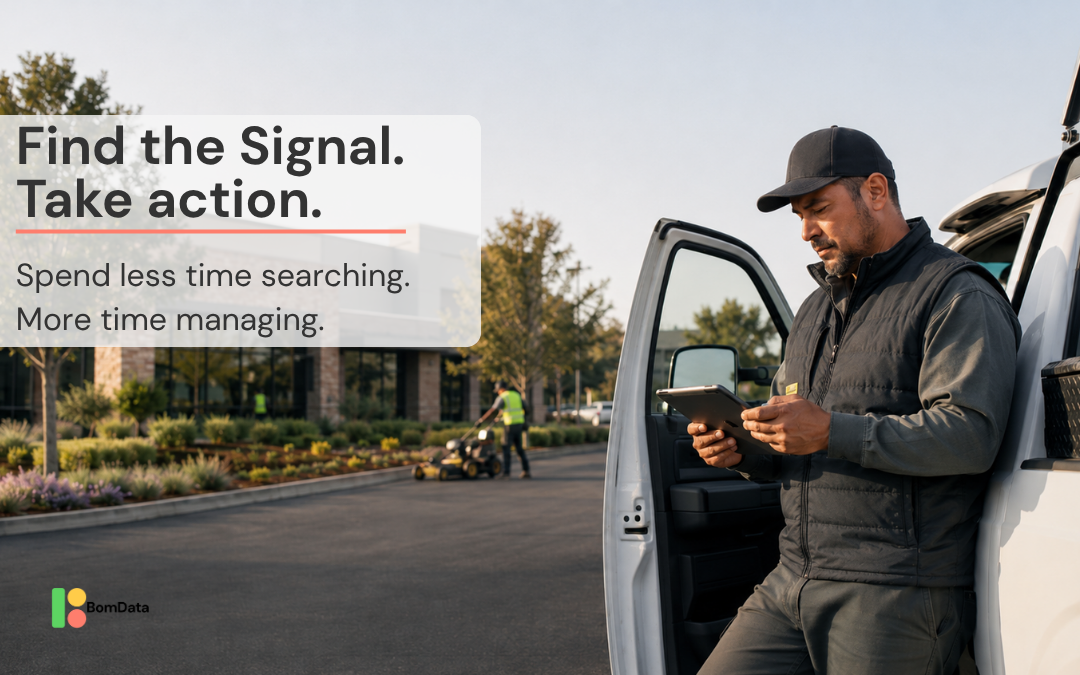
A route manager starts Monday morning with a dozen things competing for attention. Crews are heading out, schedules are shifting, customers need answers, and several properties could probably use a closer look. So where should they spend their time?
Ideally, the data makes that decision easier. Instead of digging through reports and trying to remember what happened last week, they should be able to quickly see something like:
This crew is running over estimate. Most of the variance is coming from this property. And it has happened three visits in a row.
That doesn’t tell the manager exactly what’s wrong. It tells them where to look. And that leads to what we call the 30-second test:
Can your manager get from data to a useful next question in about 30 seconds?
The goal isn’t to solve the problem in 30 seconds. It’s to make the next place to focus obvious.
More data isn’t necessarily the answer
Most commercial landscape companies already collect a tremendous amount of information through their production management software, but collecting information and using it operationally are two very different things.
If determining which crews are struggling requires a manager to pull multiple reports, adjust filters, export data, and build a spreadsheet, how often is a busy manager realistically going to do it?
Technically, the data exists. Operationally, it might as well not. That is why useful operational analytics should do more than tell you what happened last month, they should help answer:
Where should I spend my time today?
How many steps sit between the signal and the decision?
Think about the path a manager takes when trying to understand crew performance:
See a number → identify the problem → determine where it’s happening → understand the context → decide what to investigate → take action.
Every unnecessary report, spreadsheet, filter, and handoff makes that path longer. The 30-second test is a simple way to expose that friction. Ask a route manager to open the tools they normally use and answer four questions:
- Who needs my attention?
- Where is the problem happening?
- Has it happened more than once?
- What should I investigate next?
Then start the clock. If answering those questions takes 20 or 30 minutes, the issue may not be a lack of data, it may be that too much work sits between the data and the person expected to use it.
Good analytics should tell you where to look, not what to think
There is an important distinction here: a low efficiency score does not automatically mean you have a bad crew. It means you have something worth investigating.
Imagine a crew is running well below estimate. At first glance, that looks like a performance problem, but drill down and you may find that one large HOA is responsible for most of the variance.
Look at that property over several weeks and another story might emerge: The crew struggled badly at first, then the numbers started improving. A few visits later, they are much closer to target. Now the management question changes.
Instead of:
Why is this crew so inefficient?
you can ask:
What is happening at this property, and is the team already getting it under control?
The data did not make the decision, it made the next question better. That is a much more useful role for analytics.
Actionable data should change someone’s calendar
One of the simplest ways to tell whether an operational report is useful is to ask:
Does this information change what someone does next?
Suppose an operations manager reviews performance Monday morning and sees that Crew 4 has repeatedly struggled at Oak Ridge. That insight should influence the week.
- Monday: Identify Oak Ridge as a priority.
- Tuesday: Meet the crew there during service.
- Observation: The team is losing significant time unloading and staging equipment.
- Action: Change the staging plan.
- Following visits: Watch whether efficiency improves.
Now the data is not just living in a dashboard, it’s driving operations. That is the difference between reporting and management.
A report tells you what happened, useful operational data helps you decide what to do about it.
Diagnose before you coach
There is another reason managers need context quickly: the crew is not always the problem. Before telling someone to work faster, you need to know what you are actually looking at. A weak efficiency number can come from several different places.
The data might be wrong
Were crew members clocking in and out correctly? Were hours adjusted later? Is the information accurate enough to support a management decision?
If the underlying time data is unreliable, coaching from it can create the wrong behavior.
The schedule might be wrong
Did the route manager give the crew a realistic expectation for the day? If six hours of work are scheduled as eight, the crew may appear to be performing differently than it really is. The reverse is also true. An unrealistic schedule can make a crew look inefficient even when they are executing the work appropriately.
The property might be the problem
Maybe access changed. Maybe drive time is being allocated poorly. Maybe the estimate was wrong. Maybe a section of the property consistently takes longer than expected.
Or there may actually be a coaching opportunity
Sometimes the answer really is execution. A crew may need training, a different process, better equipment, or clearer expectations. The point is not to avoid accountability, it is to make sure you are solving the right problem.
A useful analytics process should help managers move through those possibilities quickly instead of jumping straight from red number to crew problem.
Better data should create better conversations
This is where operational analytics become a management tool instead of a reporting tool. Compare these two conversations.
The first:
“Your efficiency was bad last week. What happened?”
The second:
“Oak Ridge has run over estimate for the last three visits, and most of the variance looks like it’s coming from mowing. What’s different about that property?”
The second question gives the crew leader something concrete to react to. Maybe the mow pattern is not working. Maybe there is an access issue. Maybe the crew composition changed. Maybe the property was underestimated from the beginning.
The manager still needs field knowledge, judgment, and a relationship with the crew. Technology should not replace any of that, it should point those skills toward the places where they are most useful.
Try the 30-second test this week
You do not need to overhaul your reporting system to learn something from this idea. Pick one metric that matters to your operation. Crew efficiency is an obvious place to start, but it could be scheduling accuracy, labor hours, enhancement performance, or another metric your team reviews regularly. Then sit beside the person who is actually expected to act on it.
Ask:
- Who needs your attention?
- Where is the biggest opportunity?
- Is this a one-time issue or a pattern?
- What would you do next?
See how long it takes to get there.
If the answer requires five reports, three browser tabs, and a spreadsheet, do not automatically assume your managers need more analytics training. You may simply be asking them to work too hard to find the signal. Because the goal is not to make every operational decision in 30 seconds, it’s to make the next question obvious enough that your managers can spend their time solving problems instead of searching for them.
About BomData
BomData helps commercial landscaping teams turn Aspire data into clear, actionable insights for operations managers, branch leaders, and field teams. Crew efficiency, scheduling errors, hours accuracy, and property performance are surfaced through simple leaderboards and recurring reports so managers can quickly identify where their attention can make the biggest impact.
Get STarted
Work Toward Operational Efficiency
Take the first step toward operational efficiency for your landscaping business today with BomData. Contact us today for a free demo or to get started.
©Copyright BomData 2025